Real Estate News in Brief
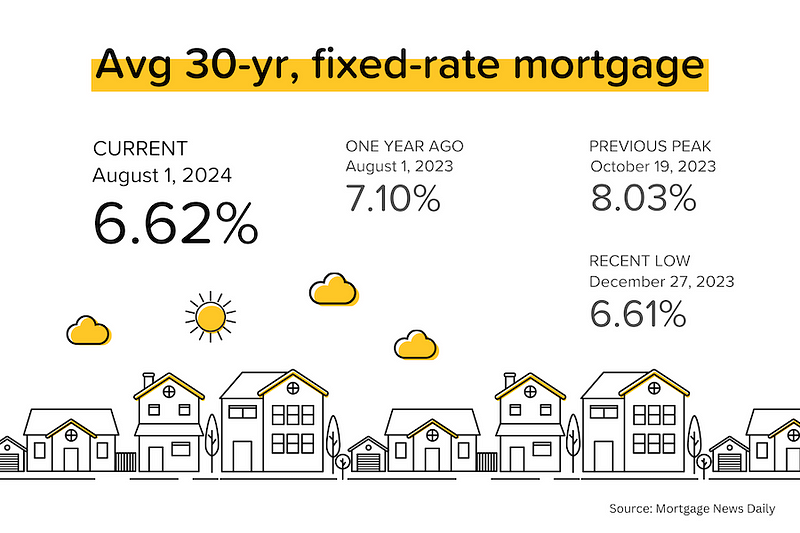
The Fed kept rates steady (again), but said that a rate cut on Sept 18 was definitely “on the table” given progress on inflation and the recent rise in the unemployment rate. The bond market rejoiced, helping to send average mortgage rates near 6.6%.
June PCE (inflation) eases further. This came out last Friday. With “headline” PCE rising only 0.1% month-over-month, the annualized figure dropped from 2.6% YoY in May to 2.5% YoY in June. “Core” PCE, however, rose 0.2% MoM, keeping the annualized figure flat at 2.6%.
‘Stale’ listings growing nationwide. 65% of the homes listed nationwide have been on the market for at least one month, and 43% for at least two months. [Redfin]
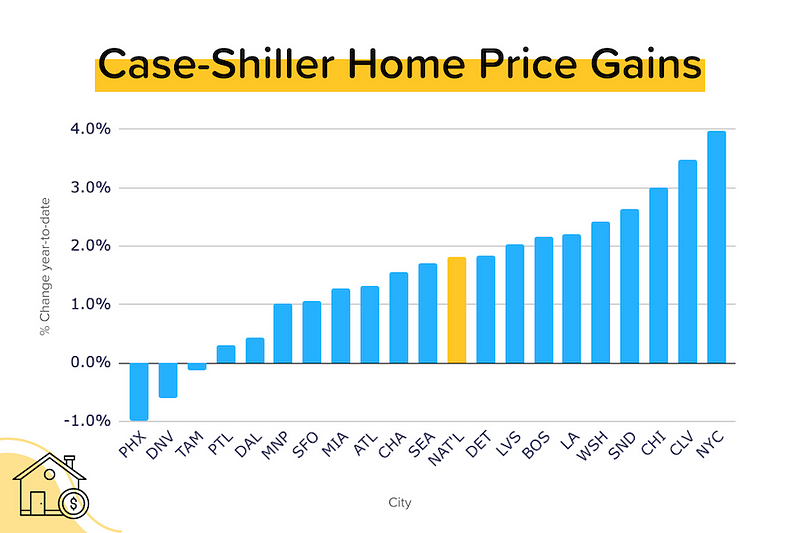
Case-Shiller: Another home price record set in May. The seasonally-adjusted national home price index rose 0.3% month-over-month in May 2024, bringing the year-to-date gains to 1.8%. On an annualized basis, that would be 4.4%. [S&P DJI]
FHFA: Home price growth decelerates. The FHFA numbers only include conforming transactions financed with a mortgage. On their numbers, home prices were flat MoM in May, but were still up 5.7% year-over-year. [More on this later.] [FHFA]
JOLTS: Job openings surprise. There were 8,184,000 job openings at the end of June, well above expectations of ~8,000,000. Additionally, the May figure was revised up from 8,140,000 to 8,230,000. That said, job openings are still down 10% year-over-year. [BLS]
ADP: Job creation and pay gains slow. Private employers added 122,000 jobs in July, well below expectations of 140,000–150,000. Annual wage growth for “job stayers” dropped to 4.8% YoY — slowest growth in 3 years. The wage uplift for “job leavers” plunged from 7.7% YoY to 7.2% YoY. [ADP]
What the Fed said. The Fed kept short-term interest rates on hold for its 8th-straight meeting (the last rate hike was in July 2023). However, Fed Chairman Jerome Powell said the improvement in inflation and the loosening of the job market put a rate cut “on the table” at the next FOMC meeting on September 18. Treasury yields and average mortgage rates promptly dropped.
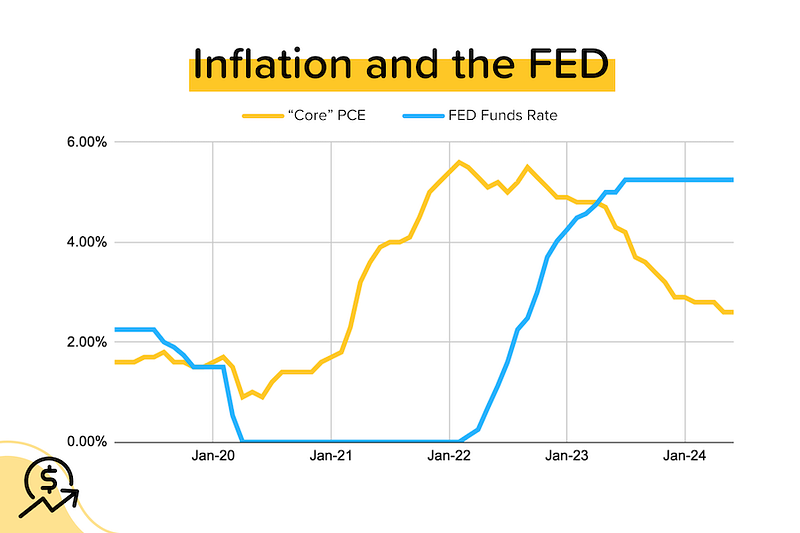
TP: The Fed hasn’t raised rates in a long time. But the steady decline in inflation means that ‘real’ (inflation-adjusted) rates continue to rise. The widening of that gap between the blue line and the yellow line is a form of tightening.
Pending sales partially rebound on lower rates. June pending sales (homes going under contract) rose 4.8% month-over-month as average 30-yr mortgage rates moved below 7%. Keep in mind, however, that the current index level of 74.3 is 3% below June 2023, 19% below June 2022 and 36% below June 2021. In other words, activity levels are LOW. [NAR]
TP: The silver lining to all this is that transaction volumes can’t go much lower, especially if the Fed starts a loosening cycle and mortgage rates keep trending lower.
Key BLS jobs report . Only 114,000 jobs were created in July. This is well below estimates of 185,000. In addition, there was a 29,000 negative reduction to the previous two months' numbers. This weakening in the employment market can help support lower interest rates in the near future.
FHFA index gets no respect, but should.
The Federal Housing Finance Authority has home price data on all 50 states and over 400 cities stretching back to the mid-1970s. It’s constructed using the same, highly accurate, repeat sales method that Case-Shiller employs. In other words, it’s tracking real home price appreciation, rather than measures like the median sales prices which are skewed by the mix of homes for sale.
But because the FHFA data comes out on the same day as the (more popular) Case-Shiller indexes, and the results often look similar, most people ignore the FHFA data. Here are two good reasons to pay attention:
- The FHFA data is available to everybody, for free. You can get monthly data at the national and regional levels, and quarterly data at the state and metro level.
- The FHFA dataset only includes home purchases that were funded with a conforming loan. That means that it excludes all-cash sales and jumbo loans. During a period where 30% of monthly sales are all-cash, that arguably makes the FHFA index more relevant to the common (not rich, not old) man.
National Home Prices % Change MoM: Case-Shiller (Blue) vs. FHFA (Red)
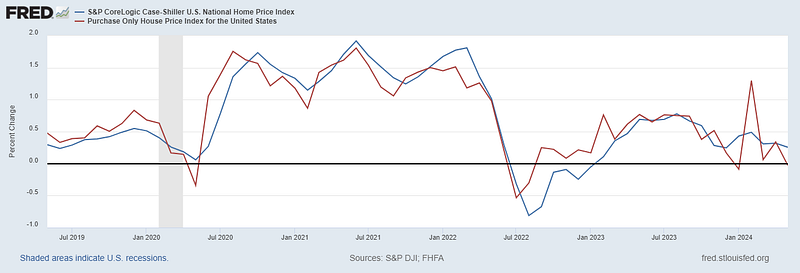
It’s pretty obvious from the graph above that the indexes generally mirror each other. That said, Case-Shiller seems to be a bit more extreme: higher growth in an upswing, lower growth or declines in a downswing. The FHFA index also appears to lead the Case-Shiller index by a month. It’s also notable that the FHFA index has shown zero or no MoM growth three times this year, while the Case-Shiller index has had MoM gains of between 0.3%-0.5% each month.
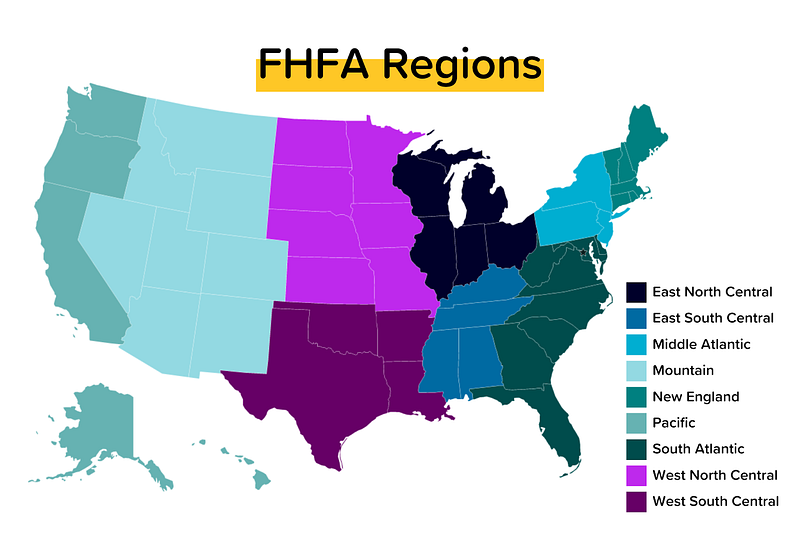
While the Case-Shiller press release shows index data for the nation and 20 big cities (New York, Tampa, Seattle etc.), the FHFA press release shows index data for the nation and 9 confusingly-named regions. Since you probably have no idea which states are in the West North Central region, here’s your map. Keep in mind that 1 or 2 states in each region have an outsized impact on the regional index, e.g. Texas for the West South Central, and Florida for the South Atlantic. That’s just a population thing.
In May 2024, Case-Shiller showed MoM price declines in the following seasonally-adjusted city indexes: Dallas, Phoenix, and Portland. In May 2024, FHFA showed MoM price declines in the following seasonally-adjusted regional indexes: East South Central (TN etc.), Pacific (CA etc.), West North Central (MO etc.), and West South Central (FL etc.).
Year-to-date home price gains (seasonally-adjusted indexes):
East North Central: +2.3%
East South Central: +1.0%
Middle Atlantic: +3.0%
Mountain: +0.4%
New England: +3.8%
Pacific: +0.7%
South Atlantic: +1.2%
West North Central: +2.7%
West South Central: +0.7%
Mortgage Market
This was a giant week for the bond market and mortgage rates. The Fed kept rates on hold, but at his press conference, Jerome Powell sounded like a man who was ready to cut rates. We will have to wait until September 18 to know for sure, but the bond markets reacted immediately to the dovish commentary.
The yield on the 10-year US treasury bond has dropped from 4.3% to under 4.0% in just over a week, and that’s helped average 30-yr mortgage rates drop to 6.62%. Finally, affordability is improving!
Here are the current odds on Fed rate cuts at upcoming FOMC meetings below. Keep in mind that the US Presidential election is on November 5.
- Sept 18: 100% (same as last week); but 14% the probability of a 50 basis points cut rose from 14% to 30%.
- Nov 7: 100% (same as last week); 66% probability that rates will be 50 basis points lower than current, 33% probability that rates will be 75 basis points lower than current
- Dec 18: 100% (same as last week); 35% probability that rates will be 100 basis points lower than current.
(Source: MBSHighway.com & ListReports.com)